Image Details
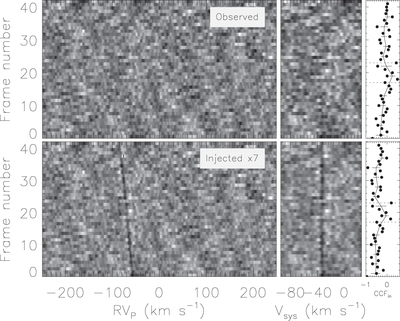
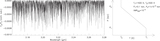
Caption: Figure 6.
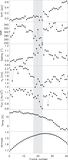
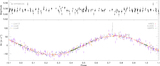
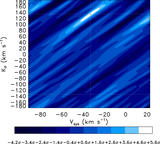
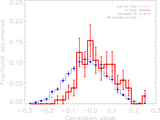
Cross-correlation functions for each spectrum using the best-matching model. Top-left: the summed CCFs for each residual spectrum after cross-correlating the best-matching H2O template with the observed data. Bottom-left: same as top-left, but with a model spectrum injected at ﹩7\times ﹩ its nominal value. Note the dark diagonal blueshifting trail of the injected planet signal. Top-middle: as in top left panel but aligned into the rest frame of the planet. The trail is located at the known systemic velocity of the 51 Peg star system (﹩{V}_{\mathrm{sys}}=-33.25﹩ km s−1). Bottom-middle: same as top-middle, but with the model injected. The top-right and bottom-right panels show the strength of the CCFs for a 3 pixel column bin centered on ﹩{V}_{\mathrm{sys}}=-33﹩ km s−1 (i.e., containing the planet signal, ﹩{\mathrm{CCF}}_{\mathrm{in}}﹩). The solid line shows the mean of 3-frame binning. Note how the strength of the CCFs approach zero between frames 18–24 (corresponding to phase ﹩\approx 0.565﹩). This occurs in both the observed spectra and in those where the model was injected prior to removing the telluric and stellar lines with SYSREM, and corresponds to the period of poor atmospheric conditions (see Figure 5). These CCFs are removed from our final analysis in Section 3.3, and are further detailed in Section 3.4.
Other Images in This Article

Show More
Copyright and Terms & Conditions
© 2017. The American Astronomical Society. All rights reserved.