Image Details
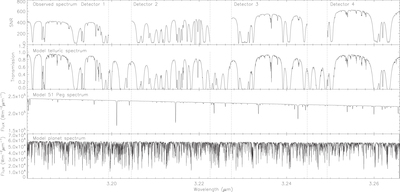
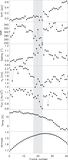
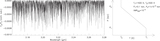
Caption: Figure 1.
Top: the photon-limited average signal-to-noise of the 51 Peg spectra observed with CRIRES/VLT. The vertical dotted lines mark the boundaries of the gaps between the detectors. Second panel: a model telluric transmission spectrum from ATRAN assuming a precipitable water vapour PWV = 2 mm at Cerro Paranal. The observed spectra are completely dominated by the tellurics. Third panel: for visual purposes only, an approximate stellar model for 51 Peg, assumed here to be the solar spectrum, shifted to match the velocity of 51 Peg during our observations. The spectrum was obtained at ﹩R\,=﹩ 100,000. Most of the strong stellar lines fall between the detector gaps. Bottom panel: an example of one of our water molecular template spectra for 51 Peg b (see Section 3.1), shifted to the velocity of 51 Peg during our observations. Note the many tens of strong absorption lines.
Other Images in This Article
Show More
Copyright and Terms & Conditions
© 2017. The American Astronomical Society. All rights reserved.