Image Details
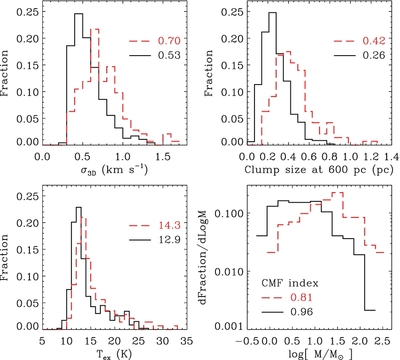
Caption: Figure 28.
Histogram of three-dimensional velocity dispersion (upper left), clump size (upper right), excitation temperature (lower left), and CMF (lower right). Red lines represent the clumps associated with YSOs, while black lines represent the clumps without YSOs. The median values and CMF indices are marked on the plot.
Other Images in This Article


Show More
Copyright and Terms & Conditions
© 2014. The American Astronomical Society. All rights reserved.
Copyright ©
2025 Astronomy Image Explorer. All Rights Reserved.