Image Details
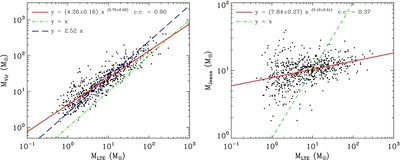
Caption: Figure 23.
Left: virial mass–LTE mass relation of the clumps. Right: Jeans mass–LTE mass relation of the clumps. The dot–dashed green line indicates a mass ratio of 1. The solid red line shows a power-law fit to the relationship. The dashed blue line in the left panel indicates the median mass ratio.
Other Images in This Article


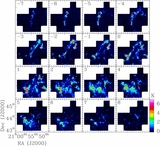


Show More
Copyright and Terms & Conditions
© 2014. The American Astronomical Society. All rights reserved.
Copyright ©
2025 Astronomy Image Explorer. All Rights Reserved.