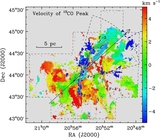
Image Details
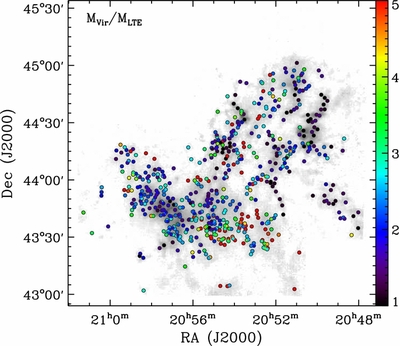
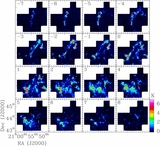
Caption: Figure 22.
Distribution of clumps with virial parameter coded. The dots represent the clumps overlaid on the integrated intensity map of 13CO. The colors of the dots indicate the virial parameter of the clumps.
Other Images in This Article


Show More
Copyright and Terms & Conditions
© 2014. The American Astronomical Society. All rights reserved.
Copyright ©
2025 Astronomy Image Explorer. All Rights Reserved.