Image Details
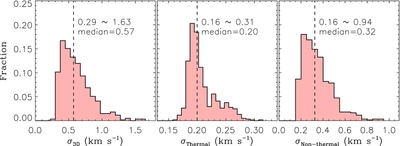
Caption: Figure 21.
Histogram of three-dimensional velocity dispersion (left), and the thermal (middle) and non-thermal (right) one-dimensional velocity dispersions. The range and typical value of each velocity dispersion are marked on each panel.
Other Images in This Article


Show More
Copyright and Terms & Conditions
© 2014. The American Astronomical Society. All rights reserved.
Copyright ©
2025 Astronomy Image Explorer. All Rights Reserved.