Image Details
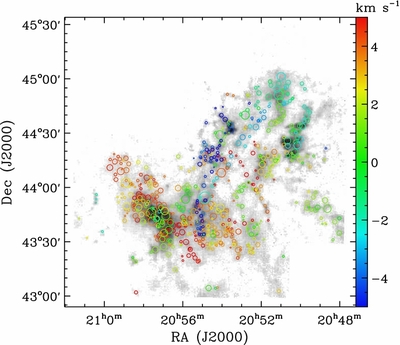
Caption: Figure 19.
Clumps identified in the 13CO data cube. The circles indicate the clump positions on the integrated intensity map of 13CO. The colors of the circles represent the velocities the clumps, while the circles are scaled according to the sizes of clumps.
Other Images in This Article


Show More
Copyright and Terms & Conditions
© 2014. The American Astronomical Society. All rights reserved.
Copyright ©
2025 Astronomy Image Explorer. All Rights Reserved.