Image Details
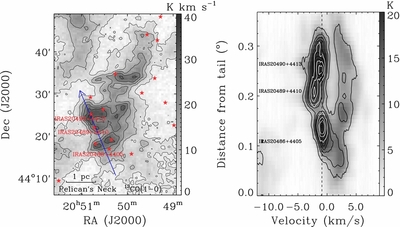
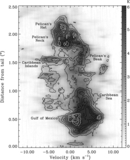
Caption: Figure 14.
Left: the 13CO integrated intensity map of Pelican's Neck. Red stars indicate the position of IRAS point sources. The names of three massive sources are indicated. The blue arrow indicates the axis of the position–velocity map. Right: position–velocity map along the axis shown in the left panel. The grayscale background indicates 12CO, black contours indicate 13CO, and white contours indicate C 18O. The lowest contour is 10σ, and the contour interval is 15σ for 13CO and 10σ for C 18O. The vertical dashed line indicates the rest velocity averaged over the whole region. Projected positions of three IRAS sources are marked.
Other Images in This Article


Show More
Copyright and Terms & Conditions
© 2014. The American Astronomical Society. All rights reserved.