Image Details
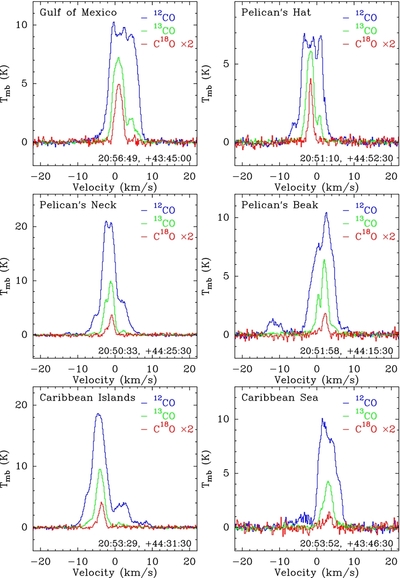
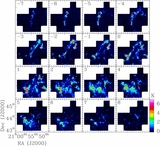
Caption: Figure 12.
Typical spectra in the selected regions with names in the upper left corner. These spectra are averaged within a 2′ × 2′ box centered at the positions (R.A., decl.) marked at the lower right corner.
Other Images in This Article


Show More
Copyright and Terms & Conditions
© 2014. The American Astronomical Society. All rights reserved.
Copyright ©
2025 Astronomy Image Explorer. All Rights Reserved.