Image Details

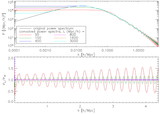
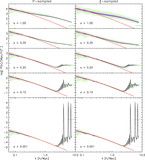
Caption: Fig. 9.
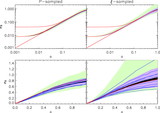
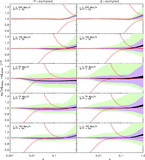
Correlation functions for the ﹩L=100\ h^{-1}\ \mathrm{Mpc}\,﹩, ﹩N=64^{3}﹩ ensembles with P‐sampled ICs (left) and ξ‐sampled ICs (right) for three output auni values, as labeled. The black region is the 68.3% confidence region on the ensemble correlation function, the purple region is the approximate 68.3% confidence region on individual realization correlation functions, and the light green region bounds all 100 realizations’ correlation functions. In the upper four panels, five individual correlation functions, for example, are overplotted in blue (the random number seeds chosen match across each panel). The red line is the linear theory prediction. As in Figs. 1 and 3, information about the correlation function is available for ﹩r> ( a_{\mathrm{box}\,}/ a_{\mathrm{uni}\,}) L/ 2﹩ from the corners of the simulation cube, but it is unlikely that this information should ever be used in rigorous analysis.
Other Images in This Article
Copyright and Terms & Conditions
© 2005. The American Astronomical Society. All rights reserved. Printed in U.S.A.