Image Details

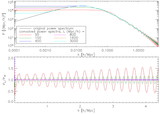
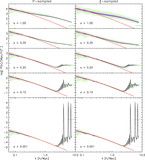
Caption: Fig. 6.
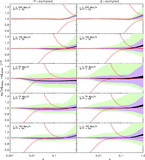
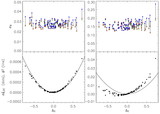
Variance σ8 as a function of scale factor auni for P‐sampled ICs (left) and ξ‐sampled ICs (right). The ensembles had ﹩L=50\ h^{-1}\ \mathrm{Mpc}\,﹩, ﹩N=32^{3}﹩. For a given auni, I calculated σ8 with a Monte Carlo integrator for each realization. The light green region shows the range of σ8 for the 100 realizations. The purple region shows the 68.3% confidence region on individual realizations, and the black "line" shows the 68.3% confidence region for the ensemble average. The linear theory expectation of σ8’s evolution is plotted as the bottom red line. The middle red line is the theoretical value with the expected lattice contribution added in quadrature; the top red line is the theoretical value with the appropriate Poisson contribution added in quadrature. The bottom panels plot the same information as the top panels, except using a linear scale, which makes clearer the discrepancy between the theoretical and calculated evolution of σ8 in the P‐sampled case, and the agreement in the ξ‐sampled case. In the bottom panels I have also plotted, with blue lines, 10 of the 100 realizations to show qualitatively individual errors due to the Monte Carlo integrator. I chose the same 10 random seeds for both the P‐ and ξ‐sampled cases. These individual evolution tracks also show qualitatively that a realization with a small value of σ8 early in the simulation has a small value later in the simulation as well.
Other Images in This Article
Copyright and Terms & Conditions
© 2005. The American Astronomical Society. All rights reserved. Printed in U.S.A.