Image Details
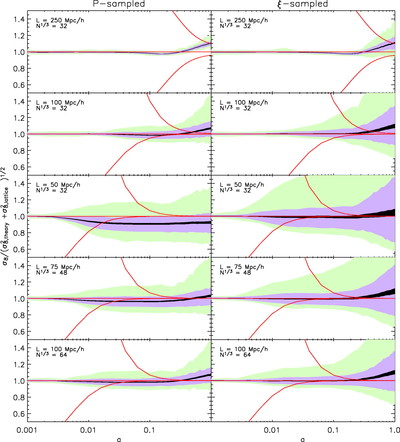
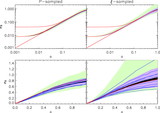
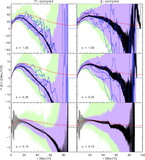
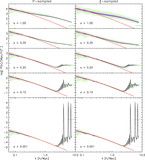
Caption: Fig. 7.
Evolution of σ8 of 10 ensembles, normalized to the linear theory prediction plus the expected lattice contribution ﹩( \sigma ^{2}_{8,\mathrm{theory}\,}+\sigma ^{2}_{8,\mathrm{lattice}\,}) ^{1/ 2}﹩. The light green, purple, and black regions and the three red lines are as in Fig. 6.
Other Images in This Article
Copyright and Terms & Conditions
© 2005. The American Astronomical Society. All rights reserved. Printed in U.S.A.
Copyright ©
2025 Astronomy Image Explorer. All Rights Reserved.