Image Details
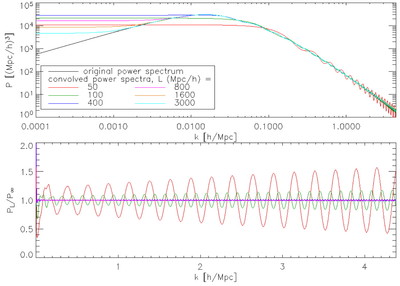
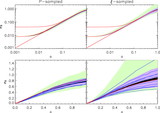
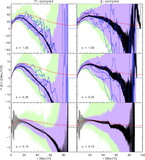
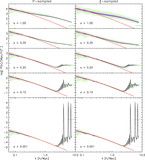
Caption: Fig. 2.
Top: CMBFAST power spectrum (black line) and convolved power spectra for ﹩L=( 50,\ 100,\ 400,\ 800,\ 1600,\ 3000) \ h^{-1}\ \mathrm{Mpc}\,﹩ (colored lines). Bottom: Convolved power spectra normalized by the CMBFAST power spectrum on a linear scale (the 1600 and 3000 h−1 Mpc cases are not plotted). The ringing in the convolved power spectra has wavelength 4π/L. Note that each convolved power spectrum is intended to be sampled with a specific interval ﹩\Delta k=2\pi / L﹩ (in three dimensions), but I have plotted them as continuous functions for illustration.
Other Images in This Article
Copyright and Terms & Conditions
© 2005. The American Astronomical Society. All rights reserved. Printed in U.S.A.
Copyright ©
2025 Astronomy Image Explorer. All Rights Reserved.