Image Details
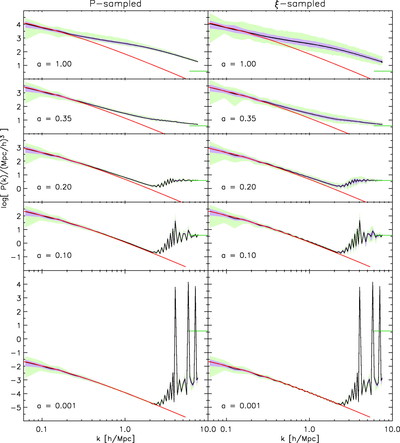
Caption: Fig. 10.
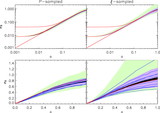
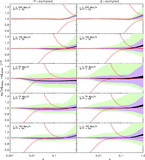
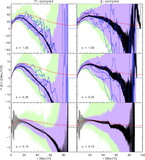
Power spectra for the ﹩L=100\ h^{-1}\ \mathrm{Mpc}\,﹩, ﹩N=64^{3}﹩ ensembles with P‐sampled ICs (left) and ξ‐sampled ICs (right) for five output auni values, as labeled. The black line, purple region, light green region, and red line have the same meanings as in Fig. 9. On the right side of each panel is a green line marking the expected Poisson noise contribution to the power spectrum, V/N.
Other Images in This Article
Copyright and Terms & Conditions
© 2005. The American Astronomical Society. All rights reserved. Printed in U.S.A.
Copyright ©
2025 Astronomy Image Explorer. All Rights Reserved.