Image Details
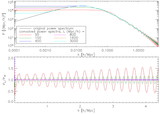
Caption: Fig. 1.
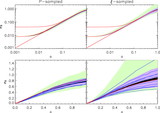
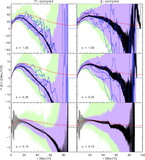
Aliased correlation functions for ﹩L=( 100,\ 200,\ 400,\ 800) \ h^{-1}\ \mathrm{Mpc}\,﹩ (thin lines). These are obtained by sampling the power spectrum on a grid, inverse Fourier transforming, and collapsing angular dependence. Because the three‐dimensional correlation function array is cubical, information about ξ(r) can be obtained for ﹩r\in [ L/ 2,\ ( \sqrt{3}/2) L] ﹩ from the "corners" of the ξ(x) array. This information about ξ(r) can be thought of as arising from correlations between the density field in opposite corners of the δ(x) box. The grid sizes were 1283, 1283, 2563, and 5123, respectively, which are large enough that this plot would look little different in the limit of infinite grid size. The thick line is the continuous inverse Fourier transform of the CMBFAST power spectrum.
Other Images in This Article
Copyright and Terms & Conditions
© 2005. The American Astronomical Society. All rights reserved. Printed in U.S.A.