Image Details
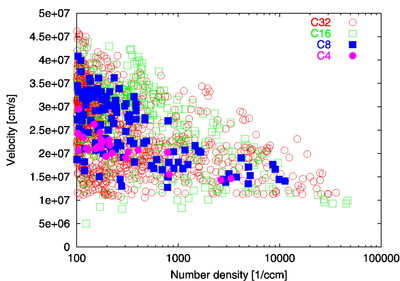
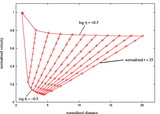
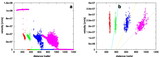
Caption: Fig. 13.
Scatter plot of velocity vs. density for the fragmentation of a single clump at different grid resolutions, ranging from 4 to 32 cells per cloud radius (runs C4 to C32). The time is the same as that of Fig. 12.
Other Images in This Article
Show More
Copyright and Terms & Conditions
© 2004. The American Astronomical Society. All rights reserved. Printed in U.S.A.
Copyright ©
2025 Astronomy Image Explorer. All Rights Reserved.