Image Details
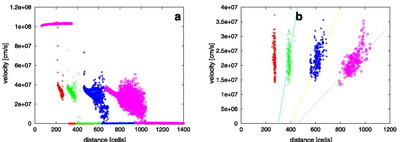
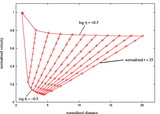
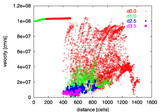
Caption: Fig. 8.
Velocities of individual cells of RUN 1 are shown (every 80th point) for times of 28.4, 44.2, 75.7, and 116.7 yr corresponding to the different symbols from left to right, respectively. In panel (a) we included the logarithm of the number density in the range from 2.5 to 3.5, and in panel (b) all values above 4.5. Lines are linear fits through the data.
Other Images in This Article
Show More
Copyright and Terms & Conditions
© 2004. The American Astronomical Society. All rights reserved. Printed in U.S.A.
Copyright ©
2025 Astronomy Image Explorer. All Rights Reserved.