Image Details
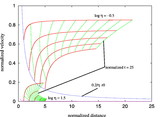
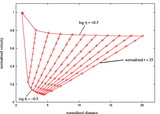
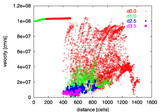
Caption: Fig. 5.
For a range of six values of η and five values of initial distances, the velocity is plotted for a normalized time of 20 after the start of the stellar wind.
Other Images in This Article
Show More
Copyright and Terms & Conditions
© 2004. The American Astronomical Society. All rights reserved. Printed in U.S.A.
Copyright ©
2025 Astronomy Image Explorer. All Rights Reserved.