Image Details
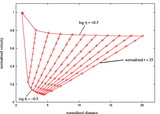
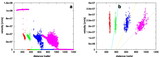
Caption: Fig. 9.
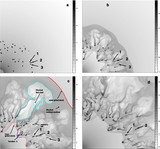
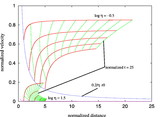
Scatter plots of velocity vs. distance from the central star are shown for RUN 2 with preexisting clouds at times of (a) 910 and (b) 1852 yr after the beginning of the fast stellar wind. Only the highest densities are shown, in order to compare the kinematics with the model calculations for the acceleration of the clump ensemble. The model is shown as points connected with solid lines. They encompass the range of values for initial distance and η appropriate to the simulation. The only clump that is outside the range predicted is that located at a distance of ≈750 cells and ﹩1.5\times 10^{7}﹩ cm s−1.
Other Images in This Article
Show More
Copyright and Terms & Conditions
© 2004. The American Astronomical Society. All rights reserved. Printed in U.S.A.