Image Details
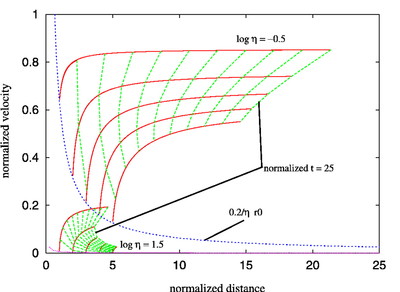
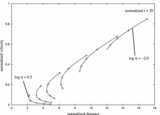
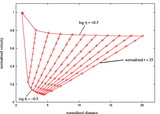
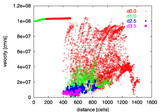
Caption: Fig. 2.
For two different values of η and five values of initial distances we have plotted the velocity of clumps as a function of normalized distance. The curves are connected among each other by isolines of normalized time. Given the time delay in the arrival of the global shock at the different positions, the initial isotime line does not include all clumps. The initial normalized internal cloud shock velocities where ﹩\overline{v}_{cs}=0.2( \eta \overline{r}_{0}) ^{-1}﹩.
Other Images in This Article
Show More
Copyright and Terms & Conditions
© 2004. The American Astronomical Society. All rights reserved. Printed in U.S.A.
Copyright ©
2025 Astronomy Image Explorer. All Rights Reserved.