Image Details
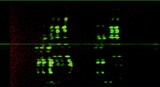
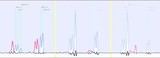
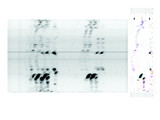
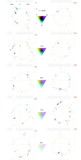
Caption: Fig. 14.
Saturated reduced low‐resolution spectrum for the slit orientation ﹩\psi _{s}=144^{\circ }﹩, showing the trail of the jet. The color triangle corresponds to the intensity 5%. The signal along the jet is up to 25% of maximum intensity, yet it is important to realize that the spectrum in this region is crowded, so that some line confusion is probable. Higher resolution and better S/N spectroscopy of this region is required.
Other Images in This Article
Show More
Copyright and Terms & Conditions
© 2004. The American Astronomical Society. All rights reserved. Printed in U.S.A.
Copyright ©
2025 Astronomy Image Explorer. All Rights Reserved.