Image Details
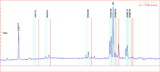
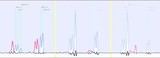
Caption: Fig. 4.
Continuum intensity at 6000 Å along the 36° slit (see the lower panel of Fig. 1). The abscissa ticks are at 10﹩\arcsec﹩ spacing, and the ordinate shows the intensity calibrated according to Carramiñana et al. (2000) and Véron‐Cetty & Woltjer (1993). Here ﹩1\times 10^{-15}﹩ ergs s−1 cm−2 Å−1 arcsec−2 corresponds to approximately 10 photon counts per pixel per 20 minutes. The dashed line indicates the continuum interpolation, and the gray circle is placed at the intensity corresponding to the interpolated nebular continuum at the position of the pulsar, where calibration is applied.
Other Images in This Article
Show More
Copyright and Terms & Conditions
© 2004. The American Astronomical Society. All rights reserved. Printed in U.S.A.
Copyright ©
2025 Astronomy Image Explorer. All Rights Reserved.