Image Details
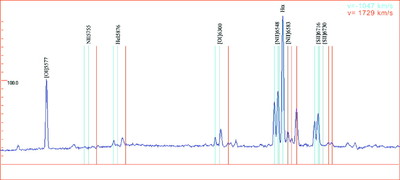
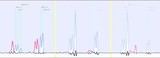
Caption: Fig. 3.
Trace ﹩S_{r}( \lambda ,m) ﹩ of the spectrum ﹩m=440\ \mathrm{pixels}\,﹩ (along the line in the lower panel of Fig. 1). Some important lines are marked: the rest positions with respect to local lamp calibration are shown by gray vertical lines, and parallel blue and red lines indicate positions blue‐ and redshifted by −1047 and ﹩1729\ \mathrm{km}\,\ \mathrm{s}\,^{-1}﹩, respectively. Absolute velocity calibrations in low‐resolution spectra are not better than ≈100 km s−1, but comparisons such as the one in Fig. 2 show that calibration shifts are the same, to within the resolution of the high‐resolution spectra, in the whole region of [N II] and [S II] lines of interest. The scale on the ordinate axis is in photon counts per pixel per 20 minutes.
Other Images in This Article
Show More
Copyright and Terms & Conditions
© 2004. The American Astronomical Society. All rights reserved. Printed in U.S.A.