Image Details
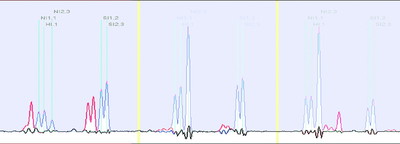
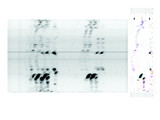
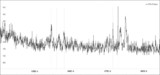
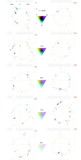
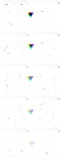
Caption: Fig. 6.
Two successive subtractions of Gaussian multiplets at remaining maximums of the velocity weight function. In the three parts of the figure, example sections of low‐resolution spectra around the Hα, [N II], and [S II] lines are shown as the border between gray and white. The first subtraction leaves the red spectral trace, and the black line marks what remains after the second subtraction. In the right‐hand spectra, the two [N II], Hα, and [S II] quintuplets are clearly separated. Noise in the spectrum remaining after the first subtraction is roughly consistent with photon counting noise. The remaining weak multiplet (red) is again subtracted out to a line whose noise is consistent with the photon counting noise. The middle spectrum shows an example in which strong and weak [N II] and Hα triplets almost overlap. The first subtraction is possibly marginally worse than in the previous case. The left spectrum shows a case in which the [N II] and Hα lines belonging to different triplets are superimposed. The automatic procedure makes no attempt to disentangle them. In the first step everything that is at the ﹩v_{\mathrm{max}\,}﹩ position of the velocity weight function for [N II] and Hα is subtracted. The second subtraction finds only a strong [S II] doublet and an Hα line.
Other Images in This Article
Show More
Copyright and Terms & Conditions
© 2004. The American Astronomical Society. All rights reserved. Printed in U.S.A.