Image Details
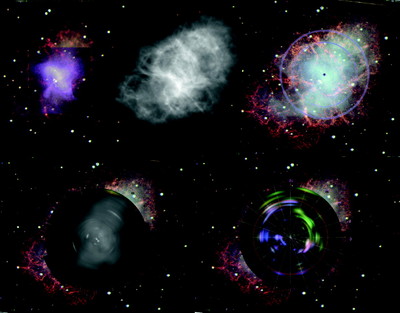
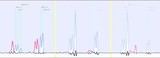
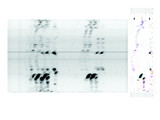
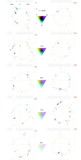
Caption: Fig. 11.
Crab Nebula image reconstruction from the spectral data. Top left: Blend of optical and X‐ray images (Weisskopf et al. 2000); top center: radio image, (Bietenholz et al. 2001); top right: optical image with the dynamical center of the nebula and the projection of the main line emitting lobe; bottom left: 6000 Å continuum; and bottom right: [N II] (green), H α (red), and [S II] (blue) spectral components.
Other Images in This Article
Show More
Copyright and Terms & Conditions
© 2004. The American Astronomical Society. All rights reserved. Printed in U.S.A.
Copyright ©
2025 Astronomy Image Explorer. All Rights Reserved.