Image Details
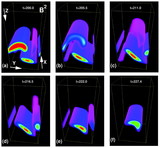
Caption: Fig. 9.
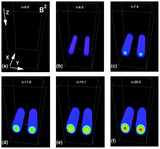
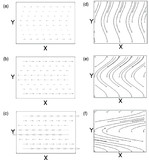
Dynamics of the shear‐buoyant instability. Here, for arbitrary x and for ﹩z=z_{v}﹩, we plot u (first column), Bx (second column), and density (third column). In the fourth column, (y, z) cross sections at arbitrary x are shown containing velocity arrows of the poloidal (﹩v﹩, w) flow and contours of B2. Each column contains five successive times ﹩t=368.6﹩ (top row), 374.6, 380.7, 386.7, 392.7 (bottom row) throughout the period of the shear‐buoyant release of magnetic structures. The adjustment of the background shear in u by the magnetically induced poloidal field can easily be seen.
Other Images in This Article


Show More
Copyright and Terms & Conditions
© 2003. The American Astronomical Society. All rights reserved. Printed in U.S.A.