Image Details
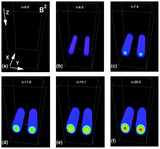
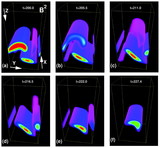
Caption: Fig. 6.
Formation of the buoyancy‐driven poloidal flow with time for the case M1. Maximum values over the computational domain of (a) ﹩v﹩ and (b) w are shown. These poloidal velocities can be seen to build up from zero to stationary equilibrium values.
Other Images in This Article


Show More
Copyright and Terms & Conditions
© 2003. The American Astronomical Society. All rights reserved. Printed in U.S.A.
Copyright ©
2025 Astronomy Image Explorer. All Rights Reserved.