Image Details
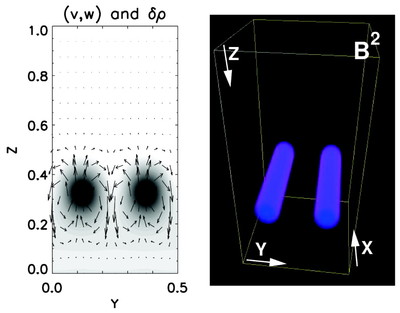
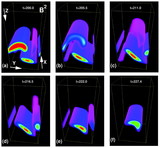
Caption: Fig. 5.
Dynamics associated with the nonstatic equilibrium achieved for case M1, shown at ﹩t=6.7﹩ (and at an arbitrary x, since the fields are x‐invariant). Left: (y, z) cross section of the domain, with shading representing density perturbation (dark is negative) and arrows indicating the (﹩v﹩, w) flow. Right: Volume rendering of B2. A density deficit can clearly be seen where the magnetic structures exist, and the poloidal flow driven by the resulting buoyancy forces is apparent.
Other Images in This Article

Show More
Copyright and Terms & Conditions
© 2003. The American Astronomical Society. All rights reserved. Printed in U.S.A.
Copyright ©
2025 Astronomy Image Explorer. All Rights Reserved.