Image Details
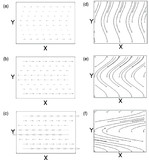
Caption: Fig. 16.
Velocity field plots exhibiting the flow field before (﹩t=346.0﹩ or ﹩t=344.1﹩ depending on the field, for clarity; left panels) and during (﹩t=348.6﹩ or ﹩t=345.4﹩; right panels) a KH episode from case VA3. Shown are the horizontal flow field (u, ﹩v﹩) at ﹩z=z_{v}﹩ (top) and the vertical flow field (u, w) at ﹩y=0.078﹩ (middle) and ﹩y=0.178﹩ (bottom). In these plots, the amplitude of u has been reduced by a factor of 50 to emphasize changes in w.
Other Images in This Article


Show More
Copyright and Terms & Conditions
© 2003. The American Astronomical Society. All rights reserved. Printed in U.S.A.
Copyright ©
2025 Astronomy Image Explorer. All Rights Reserved.