

Image Details
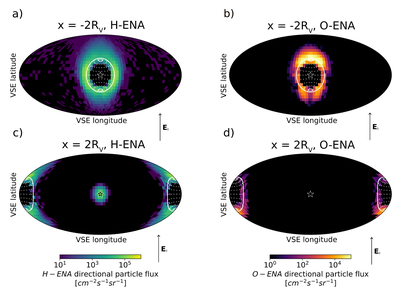
Caption: Figure 7.
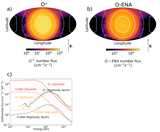
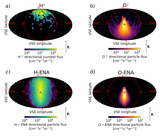
Angular distribution of ENA observations from vantage points 2RV from the center of Venus: from the anti-subsolar point, (a) hydrogen ENAs and (b) oxygen ENAs; from the subsolar point, (c) hydrogen ENAs and (d) oxygen ENAs. The plots are in the VSE frame, and the star in the center indicates the direction of the Sun. Venus’s limb is in white, and the white circles indicate the latitude and longitude lines. The images are obtained by collecting the particles that cross a 0.2RV sphere centered on each vantage point. E0 shows the direction of the convection magnetic field.
Other Images in This Article
Copyright and Terms & Conditions
© 2026. The Author(s). Published by the American Astronomical Society.

Copyright ©
2026 Astronomy Image Explorer. All Rights Reserved.
