

Image Details
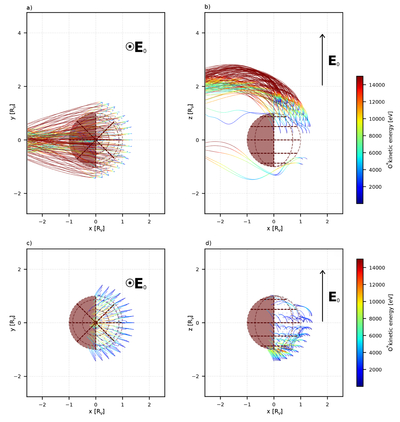
Caption: Figure 2.
Sample planetary O+ trajectories in the steady-state fields from the hybrid simulation. (a) Escaping ions seen from +z; (b) escaping ions seen from −y; (c) precipitating ions seen from +z; (d) precipitating ions seen from −y. All are in the VSE frame. E0 shows the direction of the convection electric field. The color bar shows the energy of the ions along their trajectories. O+ are starting in the dayside up to 1.45RV from the planet’s center. Please note that the O+ starting positions do not follow the distribution of O+ in the simulation.
Other Images in This Article
Copyright and Terms & Conditions
© 2026. The Author(s). Published by the American Astronomical Society.

Copyright ©
2026 Astronomy Image Explorer. All Rights Reserved.
