

Image Details
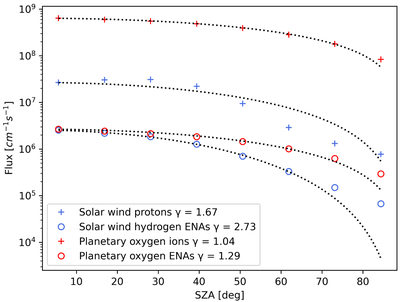
Caption: Figure 5.
SZA dependence of the precipitation of solar wind protons and planetary oxygen ions and of solar wind hydrogen and planetary oxygen ENAs, on the dayside. The dotted lines show a ﹩{\cos }^{\gamma }\left(\mathrm{SZA}\right)﹩ dependence, with the best fit for γ for each species shown in the legend. The flux values are averaged over all SZAs in a range ±5∘ from the markers.
Other Images in This Article
Copyright and Terms & Conditions
© 2026. The Author(s). Published by the American Astronomical Society.

Copyright ©
2026 Astronomy Image Explorer. All Rights Reserved.
