

Image Details
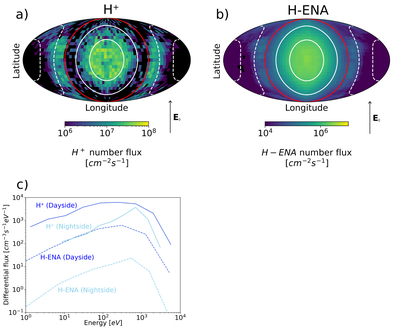
Caption: Figure 3.
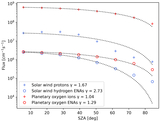
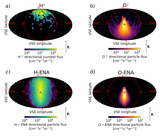
Number flux of solar wind (a) protons (labeled H+) and (b) ENAs precipitating onto the exobase of Venus in the VSE frame. The center of each panel is the subsolar point (SZA = 0∘), the white solid curves indicate the SZA 30∘ and 60∘, and the dashed curves indicate the SZA 120∘ and 150∘. The red solid curve indicates the terminator (SZA = 0∘). E0 shows the direction of the convection magnetic field. (c) Energy spectra of the proton and hydrogen ENAs on the dayside and on the nightside. The solid lines are for the proton spectrum, and the dashed lines are for the hydrogen ENA spectrum.
Other Images in This Article
Copyright and Terms & Conditions
© 2026. The Author(s). Published by the American Astronomical Society.

Copyright ©
2026 Astronomy Image Explorer. All Rights Reserved.
