

Image Details
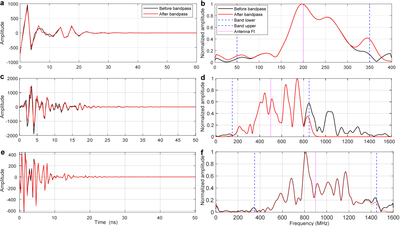
Caption: Figure A1.
Comparison of time-domain waveforms and normalized amplitude spectra before and after bandpass filtering for the nominally 100, 500, and 900 MHz GPR data. (a), (c), (e) Representative traces from the three datasets, ordered by increasing nominal frequency. Black curves denote the unfiltered signals, and red curves denote the filtered signals. (b), (d), (f) Corresponding normalized amplitude spectra. Blue dashed lines mark the lower and upper limits of the applied passbands, and purple dashed lines mark the nominal antenna center frequencies. The comparison shows that filtering suppresses low-frequency drift and high-frequency noise while preserving the principal spectral components used for radar imaging and frequency-shift analysis.
Other Images in This Article
Copyright and Terms & Conditions
© 2026. The Author(s). Published by the American Astronomical Society.

