

Image Details
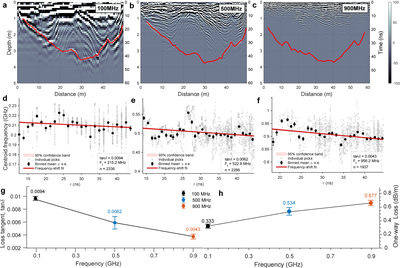
Caption: Figure 3.
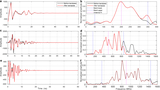
Multifrequency GPR imaging and frequency-shift-based estimates of dielectric loss and corresponding spatial attenuation in dune sands. (a)–(c) Processed GPR profiles acquired at nominally 100, 500, and 900 MHz, respectively. Red curves mark the interpreted internal reference horizons used for subsequent frequency-shift analysis and electromagnetic attenuation estimation. The three frequency bands image the dune interior with different penetration depths and resolutions: the low-frequency data provide greater penetration, whereas the high-frequency data resolve shallow structures in greater detail. (d)–(f) Frequency-shift analysis for the three datasets. Gray points show individual spectral picks, black points show binned mean values with standard errors, and red lines show linear fits of center frequency versus two-way travel time. The fitted slopes are used to estimate the effective loss tangent of the dune sands. (g) Effective dielectric loss tangent estimated for the three GPR datasets. The estimated ﹩\tan \delta ﹩ decreases from 0.0094 to 0.0062 and 0.0043, respectively, indicating consistently low but frequency-dependent dielectric loss in the dry Taklamakan dune sands. (h) Corresponding one-way dielectric attenuation rates calculated using ﹩{\varepsilon }^{{\prime} }=3.27﹩ and the fitted effective center frequency of each dataset. Despite the decrease in ﹩\tan \delta ﹩, the attenuation rates increase from approximately 0.333 to 0.534 and 0.677 dB/m, because the increase in effective frequency outweighs the decrease in ﹩\tan \delta ﹩.
Other Images in This Article
Copyright and Terms & Conditions
© 2026. The Author(s). Published by the American Astronomical Society.

