

Image Details
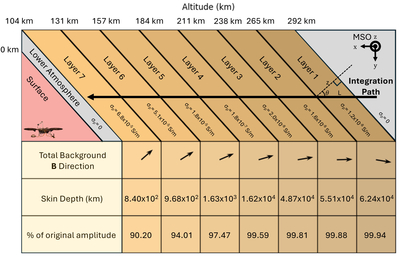
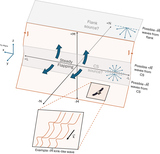
Caption: Figure 11.
Schematic of the simple model of oblique ULF wave propagation through the nighttime ionosphere. An example integration path shown here has a vertical incidence of 40°. The top half of the diagram shows the model setup. Each of the seven layers has an associated average Pedersen conductivity. The bottom half of the diagram shows the background magnetic field vector in the X–Y plane, the skin depth for each layer (Equation (10)), and the percent of original amplitude remaining after traversing through the corresponding layers.
Other Images in This Article
Show More
Copyright and Terms & Conditions
© 2026. The Author(s). Published by the American Astronomical Society.

Copyright ©
2026 Astronomy Image Explorer. All Rights Reserved.
