

Image Details
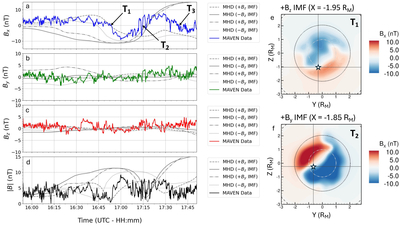
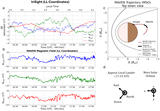
Caption: Figure 7.
(a)–(d) MHD simulation outputs with four different IMF orientations compared with MAVEN magnetic field data. T1, T2, and T3 are the same times as Figure 2. (e) Y–Z cut of MHD simulation outputs for the +Bz IMF at time A. (f) Y–Z cut of MHD simulation output for the +By IMF at time B. White stars in (e) and (f) signify the location of MAVEN at their respective times. The view is represented as if one is looking from Mars toward the magnetotail in the antisunward (−XMSO) direction.
Other Images in This Article
Show More
Copyright and Terms & Conditions
© 2026. The Author(s). Published by the American Astronomical Society.

Copyright ©
2026 Astronomy Image Explorer. All Rights Reserved.
