

Image Details
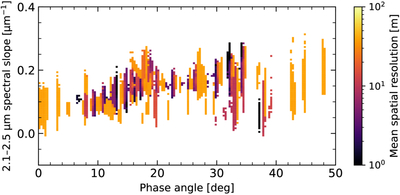
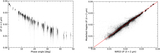
Caption: Figure I2.
Spectral slope (2.1–2.5 μm) distribution as a function of the solar phase angle [degrees]. The data were binned in a 2D slope–resolution grid using 150 × 150 bins. The color bar corresponds to the mean spatial resolution per bin. We considered only bins containing at least five points; others are considered empty.
Other Images in This Article
Show More
Copyright and Terms & Conditions
© 2026. The Author(s). Published by the American Astronomical Society.

Copyright ©
2026 Astronomy Image Explorer. All Rights Reserved.
