

Image Details
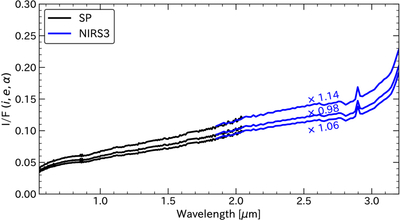
Caption: Figure D1.
Example of three comparisons of spectra from SP data (black solid line) and NIRS3. SP is reprojected to the NIRS3 geometry before the comparison. NIRS3 spectra (blue solid line) are corrected by their individual best-fit scale factor.
Other Images in This Article
Show More
Copyright and Terms & Conditions
© 2026. The Author(s). Published by the American Astronomical Society.

Copyright ©
2026 Astronomy Image Explorer. All Rights Reserved.
