

Image Details
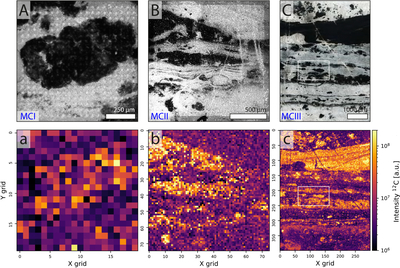
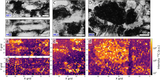
Caption: Figure 9.
Analyzed areas on the older sedimentary layers using the LMS instrument. Panels (A), (B), and (C): optical microscopy images. Panels (a), (b), and (c): respective 12C intensity maps obtained with LMS. A correlation between the 12C abundance with the darker areas on the microscopy image can be observed. For campaign parameters, see Table 1. A Raman spectroscopic map of the area shown in panel (A) can be found in Figure 4, panel (L). The white rectangles in panels (C) and (c) mark the area shown in better resolution in Figure 10.
Other Images in This Article
Show More
Copyright and Terms & Conditions
© 2026. The Author(s). Published by the American Astronomical Society.

Copyright ©
2026 Astronomy Image Explorer. All Rights Reserved.
