

Image Details
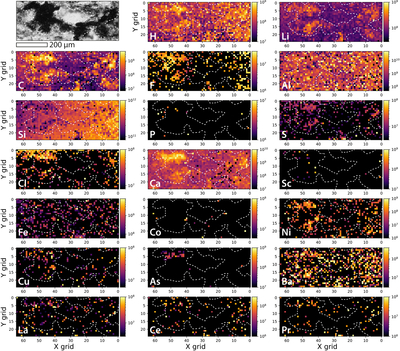
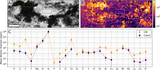
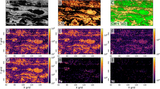
Caption: Figure 6.
A distribution of several elements of the area shown as an optical microscopy image in the uppermost left corner, studied with LMS-GT in MC1. The mass peaks were fitted using a standard Gaussian fit, and data points with R2 < 0.3 were excluded from the analysis. Furthermore, only data with SNRs >5 and mass accuracies <200 ppm are displayed.
Other Images in This Article
Show More
Copyright and Terms & Conditions
© 2026. The Author(s). Published by the American Astronomical Society.

Copyright ©
2026 Astronomy Image Explorer. All Rights Reserved.
