

Image Details
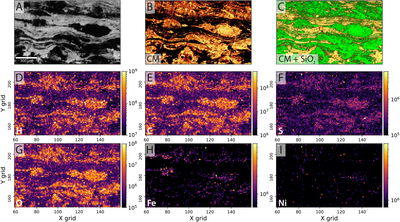
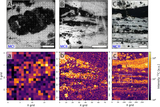
Caption: Figure 10.
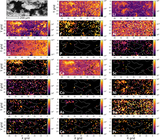
The area in the JC thin section containing CM concentrated in dark, wavy, phototrophic laminae together with dark, chemotrophic clots. Panel (A): an optical microscopy image of the sampled area. Panel (B): Raman spectroscopic map, with the orange and yellow color indicating the presence of CM. Panel (C): Raman spectroscopic map, with the green and yellow colors indicating the presence of CM and quartz, respectively. Element maps of H, C, S, O, Fe, and Ni are given in panels (D), (E), (F), (G), (H), and (I), respectively (pixel size of 15 μm). An intensity correlation of H, C, O, and S with the abundance of CM can be observed. S, Fe, and Ni signals are furthermore significantly elevated in a few single locations, presumably corresponding to pyrite grains.
Other Images in This Article
Show More
Copyright and Terms & Conditions
© 2026. The Author(s). Published by the American Astronomical Society.

