

Image Details
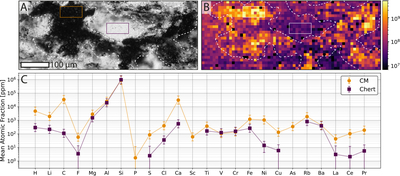
Caption: Figure 8.
A comparison of atomic fractions between regions rich in CM and chert, respectively, of MC1. Panel (A): an optical microscopy image with CM outlined with a white-dashed line, and orange and violet rectangles, respectively, for the areas rich in CM and chert analyzed in detail. Panel (B): 12C intensity map with the same outline of CM as in panel (A) and the two areas analyzed in detail marked with white rectangles. Each rectangle encompasses 32 sampled locations. Panel (C): a comparison between the mean atomic fractions across the 32 positions of the CM and the chert for 21 detected elements. Error bars correspond to deviations of a factor 0.5 to 2 from the measured value, in agreement with V. Grimaudo et al. (2017).
Other Images in This Article
Show More
Copyright and Terms & Conditions
© 2026. The Author(s). Published by the American Astronomical Society.

