

Image Details
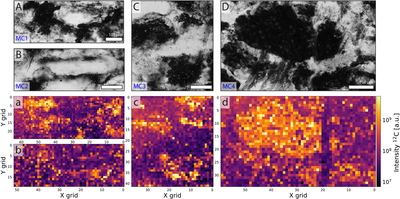
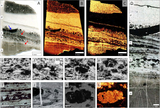
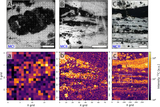
Caption: Figure 5.
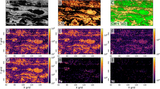
Microscopy images of the sampled areas in MC1–MC4, given in panels (A)–(D), respectively. The corresponding intensity maps of 12C are given in panels (a)–(d) (pixel size of 10 μm). For the location of the investigated areas on the sample, see Figure 3, panel (A). A correlation with the darker areas on the microscopy image with enhanced carbon abundance is clearly visible. For campaign parameters, see Table 1. Panel (A) shows the distribution of CM around a pseudomorphed volcanic particle with the CM extending outwards into the surrounding, fine-grained sedimentary matrix. This textural relationship suggests the CM is indigenous to and syngenetic with the sediment deposition.
Other Images in This Article
Show More
Copyright and Terms & Conditions
© 2026. The Author(s). Published by the American Astronomical Society.

