

Image Details
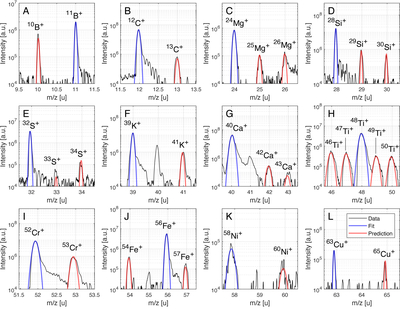
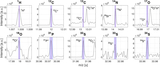
Caption: Figure 11.
Isotopes detected in the area shown in Figure 10. The most intense isotope peaks were fitted using a standard Gaussian fit (blue curve), from which the fit constants μ (mean) and σ (standard deviation) were obtained. Using these retrieved values in addition to the natural isotope abundances, the expected peaks (red curves) were added. The measured peak intensities agree well with the expected ones.
Other Images in This Article
Show More
Copyright and Terms & Conditions
© 2026. The Author(s). Published by the American Astronomical Society.

Copyright ©
2026 Astronomy Image Explorer. All Rights Reserved.
