

Image Details
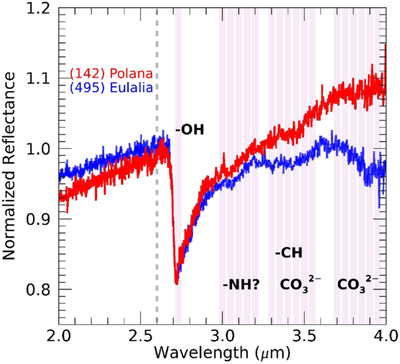
Caption: Figure 8.
Comparison of (142) Polana (red; A. Arredondo et al. 2025) and (495) Eulalia (this work). Both spectra show features around 2.72, 3.1, 3.4, and 3.9 μm, highlighted by the light purple regions. Both spectra are normalized to 2.6 μm (gray dashed vertical line).
Other Images in This Article
Show More
Copyright and Terms & Conditions
© 2026. The Author(s). Published by the American Astronomical Society.

Copyright ©
2026 Astronomy Image Explorer. All Rights Reserved.
