

Image Details
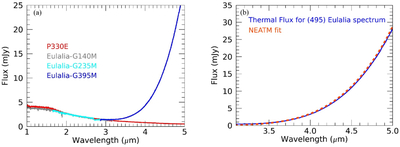
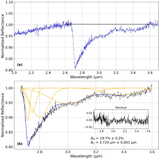
Caption: Figure 2.
(a) The irradiance spectrum of Eulalia in each of the gratings, shown in shades of blue and gray, overlaying the standard star, P330, spectrum in red. (b) The NEATM-derived model (dashed dark orange line) overlaid with the isolated thermal contribution from the (495) Eulalia spectrum (blue solid line).
Other Images in This Article
Show More
Copyright and Terms & Conditions
© 2026. The Author(s). Published by the American Astronomical Society.

Copyright ©
2026 Astronomy Image Explorer. All Rights Reserved.
