

Image Details
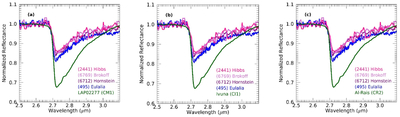
Caption: Figure 6.
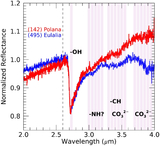
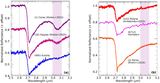
The 2.7 μm bands for the four targets in this work compared with three hydrated CC spectra measured by D. Takir et al. (2013). All spectra are normalized to 1 at 2.6 μm. No error bars are shown for figure clarity. However, error bars are shown for this work’s targets in Figure 3, and error bars for the meteorite spectra from D. Takir et al. (2013) are relatively small due to being measured in a laboratory setting. Shades of pink/purple are the PFAs’ spectra; (495) Eulalia’s spectrum is shown in blue, and (a) a CM1 meteorite, (b) a CI1 meteorite, and (c) a C2 meteorite are shown in green.
Other Images in This Article
Show More
Copyright and Terms & Conditions
© 2026. The Author(s). Published by the American Astronomical Society.

Copyright ©
2026 Astronomy Image Explorer. All Rights Reserved.
