

Image Details
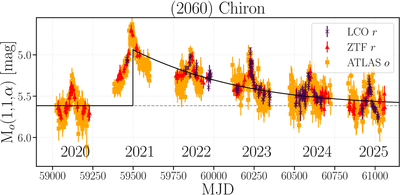
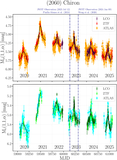
Caption: Figure 9.
Distance-corrected light curves for Chiron color-shifted to (top) ATLAS o band. The different datasets are denoted via differing colors. The solid black curve represents an exponential decay fit to the 30 day binned median data from 2021 postopposition and onward. The gray dashed line represents the baseline quiescence magnitude, calculated as the median of 2020’s observing season.
Other Images in This Article
Show More
Copyright and Terms & Conditions
© 2026. The Author(s). Published by the American Astronomical Society.

Copyright ©
2026 Astronomy Image Explorer. All Rights Reserved.
