

Image Details
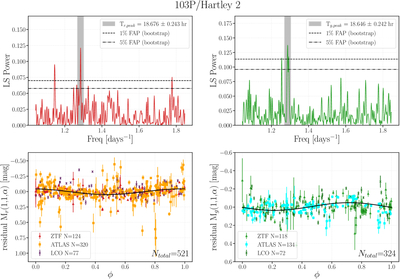
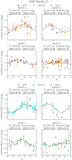
Caption: Figure 6.
Top: generalized Lomb–Scargle periodograms for the measurements color-shifted to (left) ZTF r-band and (right) ZTF g-band measurements of 103P. Highlighted in gray is the strongest power frequency peak, with the false-alarm probability (FAP, the probability that such a peak would arise from noise alone) 1% and 5% levels displayed as dashed and dashed–dotted lines, respectively. Bottom: the datasets phase-folded ϕ on the corresponding best period, with a simple single-peaked sinusoid model overlaid. The legend displays the number of data points used in each survey/telescope to construct the periodogram.
Other Images in This Article
Show More
Copyright and Terms & Conditions
© 2026. The Author(s). Published by the American Astronomical Society.

